|
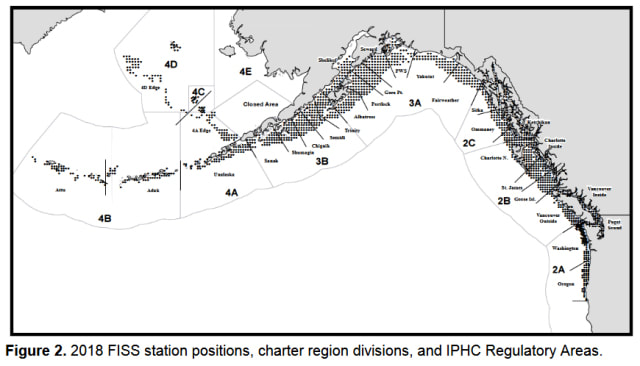
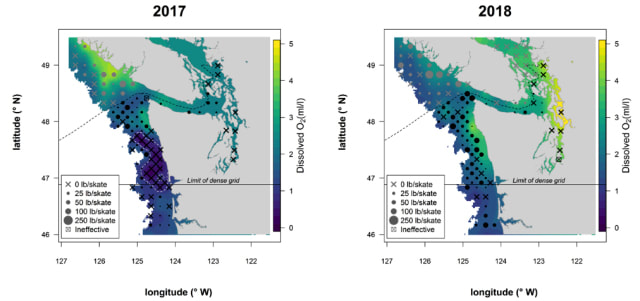
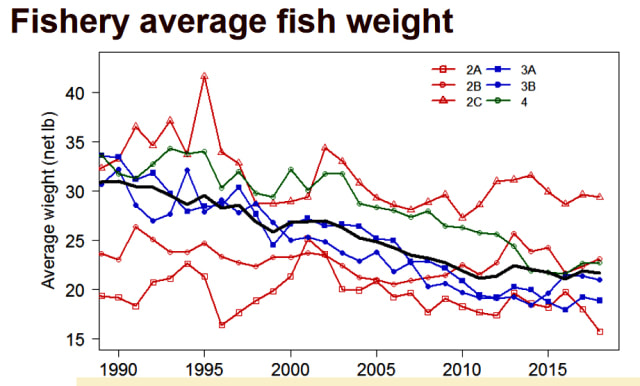
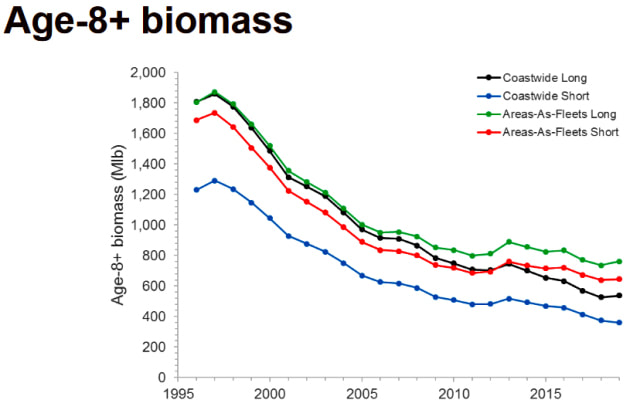
Each year the International Pacific Halibut Commission conducts a setline survey. The above map shows a series of dots or “Stations” that the contracted long line vessels dropped long line skates with hooks spread 18 feet apart. Bait used was all the same throughout the survey, #2 semi-bright chum salmon. These surveys determine the health of the overall stock throughout the Pacific Halibut range. All totaled, the setline survey caught and kept 819,975 pounds of halibut and sold it for $4,706,403.00 which pays for the survey effort. The setline survey shows the catch rate via numbers of halibut caught for each area targeted with the long lines. As a sports angler this information is fascinating if you spend the time to investigate. The IPHC Set Line Survey Interactive Map https://iphc.int/data/fiss-data-query offers invaluable data. Once on the link watch the video on how to use the interactive map and then click on each dot where the survey was done. The catch data will show on the right side of the page. This data reveals some interesting data of halibut populations and which spots contain the highest numbers of halibut. In 2017 a massive hypoxia event occurred off the coast of Washington resulting in almost no halibut present in the purple area during the setline survey. In 2018 there was no hypoxia event and the halibut returned which bodes well for Washington halibut anglers. Last year’s setline survey revealed the following
“We are now down to the lowest numbers of halibut in our set line survey since the 1990’s,” said Dr. Ian Stewart from IPHC
I’ll keep all of you updated as the IPHC meetings this week continue. These meetings should result in seasons and quotas.
1 Comment
|
- Home
- Halibut Fishing Tackle Store
- Halibut Fishing Blog
- Halibut Fishing Maps
- Halibut Articles
- Contact Us
- Halibut Fishing Videos
- About Us
- SHIPPING & RETURNS
- Store Policy
- Halibut Tips And Tricks
- Halibut Boats
- Halibut Resorts
- Weather and Tides
- Size Chart
- Halibut Comments
- Halibut Recipes
- Big Catches
- Halibut Photos
- Spoons
- Christmas Special
Our AddressSquidPRO Tackle
PO 1060 Carlsborg, WA 98324 We welcome phone orders |
TELEPHONE206-999-FISH (3474)
|
|
Important Links
| Salmon Fishing Lures | Ball Bearing Swivels | Halibut Fishing Tackle | Super Squids | Deep Stinger Jigs |
| Kenai River King Salmon | Lingcodfishing.net | GoFishMagazine.com | Dartjigs.com | TunaFishingLures.com | BriteBiteTackle.com | |UnderwaterFishingLights.net | FishingTackleStore.net | SportShrimping | Halibut Chronicles | Salmon Chronicles
| SquidLures.com | | Lets Talk Oudoors YouTube Channel | | DeepStinger.com |
©2023 by Halibut
Copyright John L. Beath
Copyright John L. Beath


 RSS Feed